Marketing budgets are under more scrutiny than ever. Marketers are increasingly asked to prove not just what they have done but whether it delivered measurable business value.
In a recent CIM member webinar, Measuring what matters: How to prove your marketing works (and why it matters), course director and Chartered Marketer Gavin Llewellyn shared practical strategies for building confidence in marketing effectiveness, balancing short- and long-term measurement and using frameworks to communicate impact clearly.
The session sparked a lively Q&A, and in this follow-up blog, Llewellyn answers the most popular questions from CIM members, focusing on making measurement accessible, actionable and aligned with what senior leaders want to see.
1. What is attribution modelling and incrementality testing, and how do they work?
Attribution is the process of assigning credit to marketing touchpoints that influence a conversion. Common models include first-click, last-click and multi-touch. These models offer speed and granularity but can also introduce bias. For example, last-click attribution often over-credits lower-funnel channels, such as paid search.
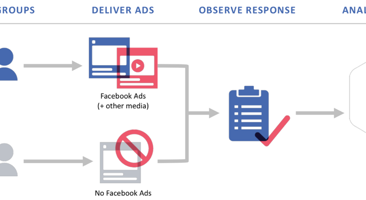
Incrementality testing asks a different question: what would have happened if we had not run the campaign? By splitting an audience into a randomised treatment (who see the ad) and control group (who do not), marketers can measure the true uplift created. A familiar example is Meta’s Brand Lift studies, which show whether exposed audiences have higher recall or intent than unexposed ones.
Neither approach is perfect. Attribution is fast but biased, whilst incremental testing is rigorous but harder to scale. But when used together, they can provide a more reliable picture of effectiveness.
Takeaway: Use attribution for ongoing optimisation and incrementality to validate whether spend is genuinely creating new value.

2. How does econometrics apply to marketing activations and campaigns?
Econometrics, often called marketing mix modelling (MMM), uses statistical analysis to estimate how different factors contribute to sales or revenue. It incorporates multiple years of data across marketing channels and external influences, such as macro market conditions, seasonality or competitor activity.
For example, a model might show that TV explains 25 per cent of sales uplift, paid search 15 per cent and promotions 20 per cent, with the remainder explained by pricing or distribution. This helps leadership allocate budgets more confidently.
The drawback is that MMM is slower, data-heavy and usually best suited to larger organisations with sufficient history (and budget!). It is not the right tool for daily optimisation but invaluable for strategic decisions.
Takeaway: Use econometrics when you need board-level confidence in what really drove growth, not to make weekly campaign adjustments.
3. How do you measure brand and long-term impact, including awareness, recall and intent?
Not every marketing activity produces an immediate sale, but many create the conditions that make future sales more efficient. Measuring this long-term impact requires tracking leading indicators and proxies that link to outcomes.
- Awareness: Regular brand tracking surveys measure unaided and aided recall. Rising branded search queries in Google Search Console is another signal that more people are actively seeking you out
- Consideration and intent: Survey questions such as “How likely are you to choose [Brand] next time you buy [category]?” provide a direct measure. Search behaviour linked to category entry points (e.g. “Nike running shoes”, “HSBC mortgage rates”) shows intent in action
- Community building: Look beyond likes and followers to meaningful signals, such as repeat attendance at events, quality of comments or referrals
The IPA Effectiveness Databank shows that brands with stronger awareness and consideration convert more efficiently in performance campaigns. In other words, long-term investment pays back by reducing customer acquisition costs (CAC).
Takeaway: Track awareness, recall and intent consistently. Use surveys and search data for rigour and show how they make performance spend more efficient.
4. How do you build a measurement story that resonates with executives and different stakeholders?
Different stakeholders view marketing through different lenses. Finance looks for ROI and payback. Sales will be more interested in pipeline health. Leadership wants growth and market share. Marketers often highlight reach and engagement.
To cut through, reporting must speak a common language:
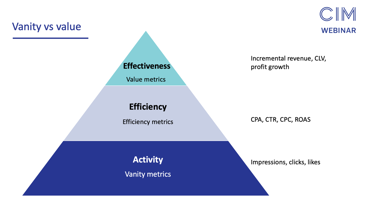
- Start with outcomes: Anchor reporting in business results such as incremental revenue, customer lifetime value (CLV) or profit growth
- Cascade to efficiency metrics: Show CAC, ROI and pipeline conversion as the bridge to financial outcomes
- Leave activity signals at the base: Clicks, impressions and likes have value but should sit behind the bigger story
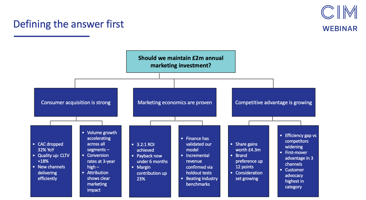
Narrative is as important as numbers. Use an answer-first approach (“Yes, our £2M investment is paying back, here’s why”) and then layer supporting evidence. Stories, analogies and case studies help executives connect emotionally. Grace Kite’s fishing pond analogy is a good example: performance marketing is catching fish today, whilst brand investment stocks the pond for tomorrow.
Takeaway: Effective reporting combines layered metrics with clear storytelling. Executives need both evidence and a narrative that links spend to sustainable growth.

5. In B2B, how should marketers measure CAC and CLV with long sales pipelines?
B2B sales cycles are longer and more complex but CAC and CLV are still two of the most persuasive metrics.
- CAC: Divide all sales and marketing costs by the number of new customers or accounts won. Account-level measurement is often better than individual contacts since multiple stakeholders influence a deal
- CLV: Factor in average contract value, renewal rates and cross-sell opportunities. In SaaS, for example, multiply average subscription value by retention probability and expected contract length
The case is strongest when you show efficiency improvements. For example, “Marketing-nurtured accounts convert 30 per cent faster than cold ones”, or “Customers acquired via content marketing renew at a higher rate”.
Takeaway: Present CAC and CLV at account level and frame them as efficiency gains that justify marketing’s role in pipeline and retention.
6. What about metrics that are harder to link to sales, such as offline activity or vanity metrics?
Offline channels and vanity metrics can be seen as weak links but both still have value when used appropriately.
- Offline measurement: Events, sponsorships and print may not provide click data but you can track recall and intent through surveys, capture direct responses (e.g. QR code scans) or compare uplift in regions where activity took place. In B2B, event attendance often accelerates pipeline progression
- Vanity metrics: Impressions, likes and clicks are diagnostic signals. They help identify whether content reached the right people and resonated. The mistake is to present them on their own as proof of business value
The trick is to connect these signals upwards. Offline recall or engagement should be linked to pipeline metrics. Vanity metrics should ladder up to conversions and revenue.
Takeaway: Vanity metrics are useful as context but should never be the headline story when proving marketing’s value.

7. How much budget should be allocated to testing and experimentation?
Testing is key to progress. A useful rule of thumb is to allocate 5 to 10 per cent of total spend to experimentation.
- Smaller or early-stage businesses may lean closer to 5 per cent, focusing on quick wins, such as A/B testing creative or landing pages
- Larger or more mature organisations can justify 10 per cent or more, running structured incrementality tests, market splits or brand lift studies
The aim is not to spend for the sake of it but to invest in confidence. Well-designed tests prevent wasted budget and prove what really drives impact.
Takeaway: Treat testing as an investment. Ring-fence 5 to 10 per cent of budget to build confidence and improve efficiency over time.
Proving marketing’s impact is not about chasing a single magic metric. It is about connecting activity to business outcomes, blending methods such as attribution, incrementality and econometrics and presenting results in a way that resonates with stakeholders.
The questions we received during the webinar show how challenging this can be in practice but also how progress is possible. By focusing on what matters, marketers can move from reporting numbers to telling compelling stories of value.
To hear more from Gavin LLewellyn, CIM members can watch back his recent webinar now. The session will help you learn how to take control of your measurement approach and confidently connect your marketing activities to business outcomes.
Related content
Explore related content and courses for further insight


